
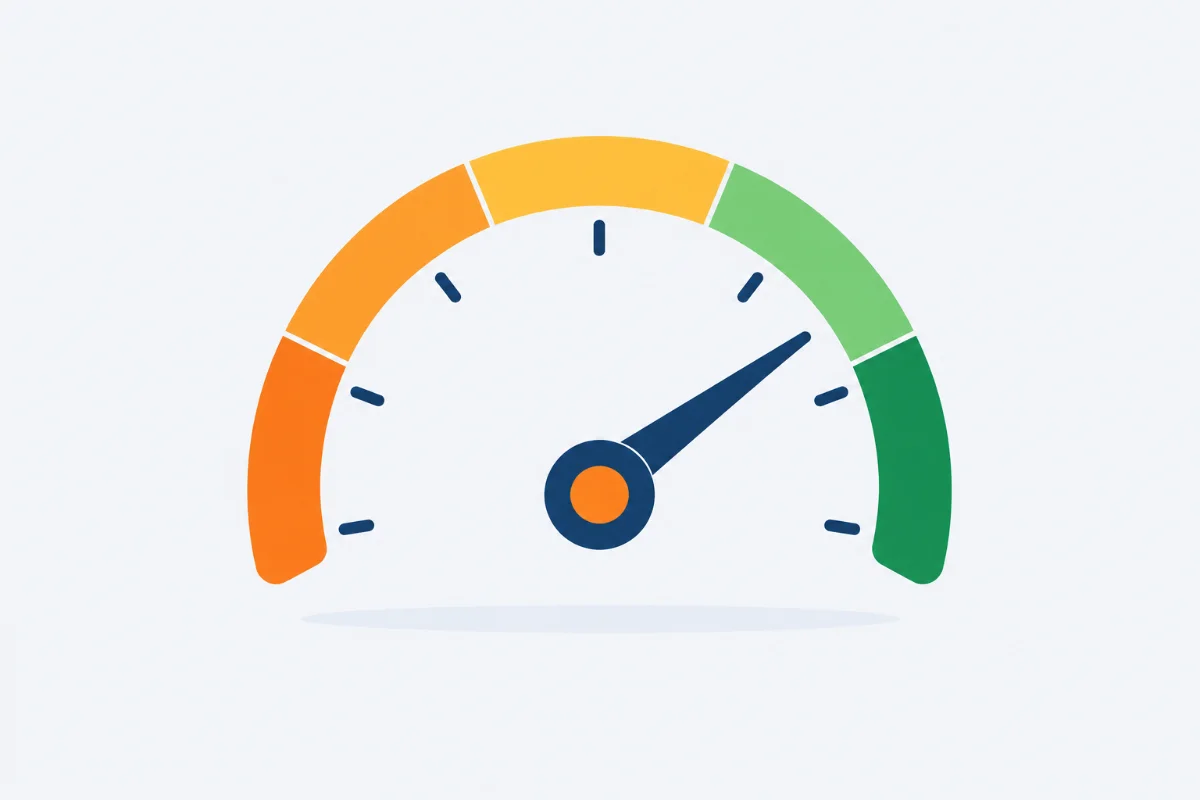
A number from 0 to 100, in red, orange or green: it’s the first thing you see when you check your site with PageSpeed Insights or Lighthouse. Your Google Lighthouse score is useful, but it should be read for what it is: a lab estimate, not a measure of your visitors’ real experience.
What Lighthouse measures
Lighthouse is Google’s free tool that analyzes a page and gives scores from 0 to 100 in four categories: Performance, Accessibility, Best Practices and SEO. The Performance score combines several speed metrics measured in a simulated test. There are three bands: green from 90 to 100, orange from 50 to 89, red from 0 to 49.
Why mobile and desktop give different numbers
The mobile test simulates a mid-range phone on a slow 4G connection. The desktop test simulates a more powerful computer on a fast network. That’s why the desktop score is almost always higher. It isn’t an error: they’re two different scenarios. Start with mobile, which for many sites accounts for most visitors.
Lab data and real-world data
PageSpeed Insights shows two distinct things. At the top, when available, real visitor data collected by Chrome over the last 28 days. Further down, Lighthouse’s lab test. Google evaluates Core Web Vitals on the real-world data, not on the lab score.
The three Core Web Vitals
They measure real experience and count as good when, for 75% of visits, they fall within these thresholds:
- LCP Largest Contentful Paint: how long the main element takes to appear, often an image or a heading. Good within 2.5 seconds.
- CLS Cumulative Layout Shift: how much the page moves while loading, for example when an image pushes down the text you were reading. Good below 0.1.
- INP Interaction to Next Paint: how long the page takes to respond to a click or tap. Good within 200 milliseconds.
In the lab test Lighthouse doesn’t measure INP, which needs real people interacting: it uses Total Blocking Time (TBT) as an estimate.
100 isn’t the goal
A site rich in images, video or interactive features will hardly reach 100, and that’s fine. The realistic goal is to stay in the green on mobile, or to improve on your starting point, without sacrificing content visitors need.
Where to start
Below the score, Lighthouse lists the specific suggestions for that page. Starting from those, rather than applying generic advice, means working on what was actually detected. For the most common WordPress fixes, see the guide on how to speed up a WordPress site.
FAQ
Does the Lighthouse score affect rankings?
Not directly: the score is lab data. Google uses Core Web Vitals measured on real visitors, along with many other signals.
A high score doesn’t guarantee good rankings and a low one doesn’t rule them out: speed is one factor among many. What counts is the real experience of the people visiting your site.
Why does the score change every time I test?
Because network, server and test device vary slightly with each measurement. Differences of a few points are normal.
Look at the trend across several tests, or the average, rather than a single number. A real improvement shows up consistently.
Should I optimize for mobile or desktop?
Mobile: for many sites it’s most of the traffic and it’s the stricter test. Google also uses the mobile version to index your site.
Optimizing mobile usually improves desktop too, while the reverse isn’t guaranteed. Still check both, because users differ.
What’s the difference between Lighthouse and PageSpeed Insights?
Lighthouse is the tool that runs the test. PageSpeed Insights uses it and adds real visitor data.
Lighthouse is also built into Chrome’s developer tools and runs on your computer. PageSpeed Insights runs on Google’s servers, so its results depend less on your machine.
Why doesn’t PageSpeed Insights show real data for my site?
Because Google only shows it when it has collected enough visits from Chrome. New or low-traffic sites often don’t have it.
In that case you’re left with the lab test. You can still use the Core Web Vitals thresholds as a target and measure improvements with tests until traffic grows.
This article is for informational purposes. SEO results depend on many factors and timelines vary by site.